shickingbrits wrote: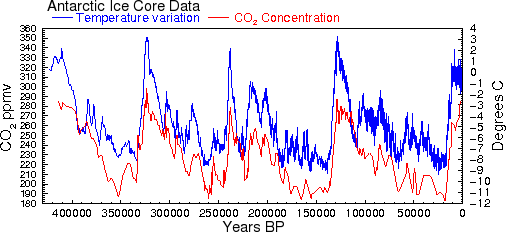
I was shown this or a very similar graph in my climate change course. Looks like a very close correlation between CO2 and temperature.
But then I independently found out that temperature precedes CO2 rises by hundreds of years, how many hundreds? At minimum 300, but more like 600-800.
I wonder why the professors didn't mention that? Is this an example of data manipulation?
I don't know why they didn't mention it, but probably because it doesn't matter. There aren't many internal natural mechanisms that can just start spontaneously shooting out enough carbon dioxide to change long-term climate evolution* -- you need some sort of external trigger to begin that process before the runaway feedback process can start. In these interglacial periods, the trigger is probably changes in solar forcings due to orbital variations. Once this starts releasing some extra CO2, that's enough to begin the feedback process, and then you start getting more water in the atmosphere, etc. Indeed, whether or not temperature changes were what triggered the feedback loop from starting, the feedback loop
definitely happened, because the changes in solar forcing are way too weak to explain the observed warming. From our perspective, we should be worried either way. The temperature
has already warmed, by nearly 1 degree Celsius, and if that generally causes huge feedback loops, the type that differentiate ice ages from warm interglacial periods, we should be worried.
*Volcanoes have been explained as a possible mechanism, I believe, but I think they are not currently favored.
DY wrote:The graph shows that temperature has increased from the 1979-1983 average. Why wouldn't they just put it in absolute terms (model A predicted 30deg global average, real global average was 29.3 as opposed to model A predicted 0.2 deg change from 1979-1983 average[does any model strive for those terms... I doubt it] real change was 0.02 deg). That implies that something really fishy is going on. Also, how many climate models were there in 1983?
Yeah, this is basically the problem. If you pick some arbitrary small period of years as a starting point, it's very easy to manipulate the data. Notice how up until about maybe 2004 or so, there's very good agreement in the
trend of the data, it's just offset vertically from the observed surface temperature. This is an artifact of the particular years he chose. If you use a different baseline, particularly one that's longer, you generally see good agreement between the CMIP models and the empirical data for many decades of the 20th century. It's only around the 2004 point that the models start to slightly diverge from the data, because the slowdown in surface temperatures we saw for about 10-15 years was not really expected.


